Find your way around
The dashboard, the side menu, the top bar and the banners of the PeekRank app, and what each one is for.
The PeekRank app has three areas: the top bar, the side menu on the left and the page you're working on. On a phone, the side menu opens from the menu button.
The dashboard
Your toolkit opens when you sign in or click the PeekRank logo. It has a card per tool, in two sections:
| SEO | AI Visibility & AEO/GEO |
|---|---|
| Rank Tracking: track keyword positions every week | Prompt Tracking: whether ChatGPT, Gemini, Google AI and Perplexity name you, and where |
| Keyword Research: volume, CPC, difficulty and intent | Share of Voice: how much of the AI conversation is yours, engine by engine |
| Domain Overview: traffic, keywords and backlinks for any domain | AI Overviews: whether Google's AI Overview cites you for your keywords |
| Backlink Overview: referring domains, backlinks and anchors for any domain | AI Sources: the pages AI answers cite in your space |
| Competitor Gap: the keywords you're missing vs competitors | |
| Site Audit: technical issues and how to fix them |
Click Open → on a card to use the tool.
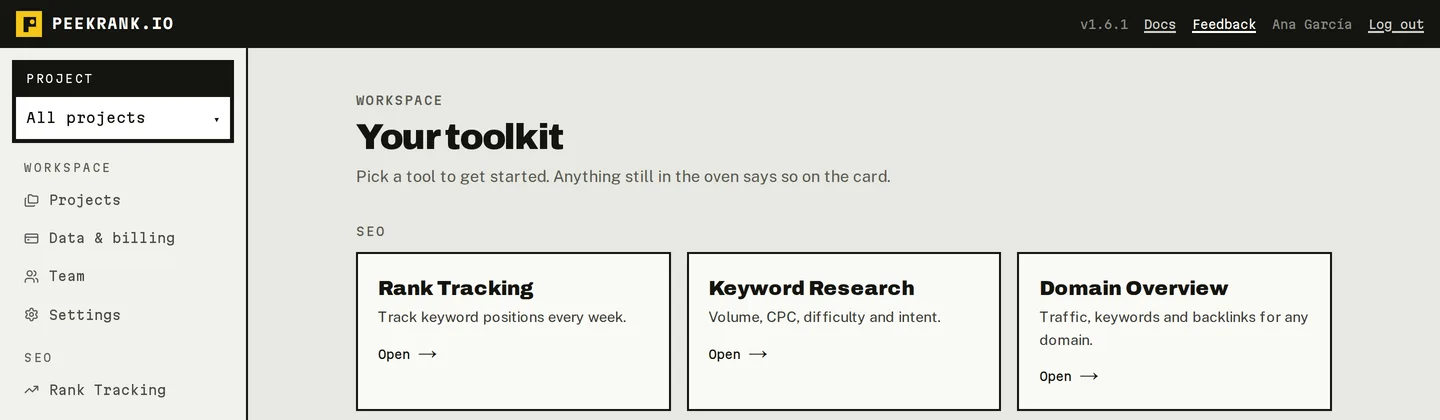
Your toolkit.
The side menu
From top to bottom:
- Workspace: only if you belong to more than one workspace. Your own one says "(yours)". Picking another one takes you to its dashboard.
- Project: jump to one of your projects (listed by domain), or All projects.
- Projects: your projects and the keywords you track.
- Data & billing: your free data, your balance and what was spent. Only owners and admins see it.
- Team: the people in the workspace and pending invites.
- Settings: report branding, your AI assistants and API keys, the security log and your account. What you see depends on your role.
- The SEO tools and the AI Visibility & AEO/GEO tools (in green), the same ones as on the dashboard.
Prices on buttons
Buttons that fetch data show their price before you click it, for example Analyse · ≈ $0.096. Point at a button to see the details: the typical cost of your recent runs and the most it can cost. After a run you see what was billed. Re-opening something you already ran is free, and so is everything that doesn't fetch new data. See How PeekRank works.
Banners
A banner can appear at the top of every page:
| Banner | What it means | Who sees it |
|---|---|---|
| This month's free data is used up or Your balance is used up (red) | Billed tools and automatic checks are paused until your free data refills on the 1st, or until someone tops up. Nothing is lost. | Everyone |
| … of data left until your free data refills (yellow) | You're running low. | Owners and admins |
| Today's data limit is reached (red) | The workspace hit its daily safety limit. Billed tools work again after 00:00 UTC; your balance is untouched. | Everyone |
| Your AppSumo lifetime deal is waiting (yellow) | You started activating an AppSumo license. Click Activate it now to finish. | You |
Click See your balance → in a balance banner to open Data & billing.
Lists and tables
Most lists share the same controls:
- A search box to filter rows, and filters by column (intent, severity, status…).
- Columns to show or hide columns.
- Export CSV, and Copy, which copies the rows as a table you can paste straight into a spreadsheet.
- Tick rows to act on them: Export selection, Add to project, Check now, depending on the list. Select all … matching selects every row that passes your filters, not just the ones on screen.
Last updated on